Backend Engineering / Observability
OpenTelemetry: Standardizing the Future of Production Observability
Stop being locked into proprietary monitoring tools. Learn how OpenTelemetry (OTel) creates a unified, vendor-neutral standard for logs, metrics, and traces.
Written by

Codehouse Author
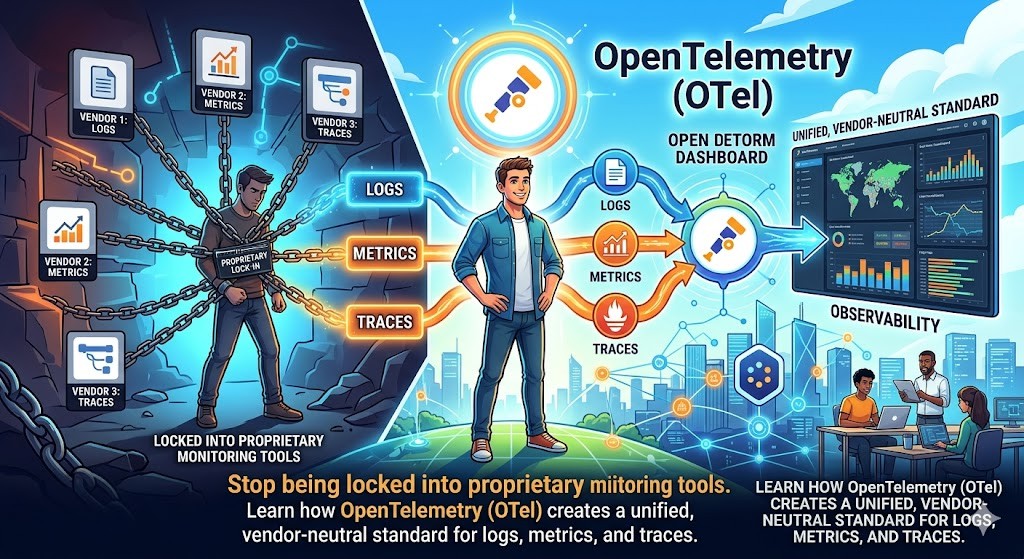
In the early days of microservices, observability was a fragmented nightmare. If you wanted to monitor your system, you had to pick a vendor—be it Datadog, New Relic, or Honeycomb—and bake their proprietary SDKs directly into your application code. This created a "hotel California" effect: you could check in anytime you liked, but you could never leave. Switching vendors meant rewriting your entire telemetry layer, a cost so high that most teams simply stayed stuck with sub-optimal tools. This is the exact problem that OpenTelemetry (often abbreviated as OTel) was designed to solve.
OpenTelemetry is not a backend for storing your data. Instead, it is a high-quality, vendor-neutral framework for generating, collecting, and exporting telemetry data (logs, metrics, and traces). It is the result of a merger between OpenTracing and OpenCensus, now maintained by the Cloud Native Computing Foundation (CNCF). For a senior engineer, adopting OTel isn't just about "better charts"—it is about architectural freedom and standardizing how your system communicates its health.
1) The End of Vendor Lock-In
The most immediate benefit of OpenTelemetry is vendor neutrality. By using the OTel SDKs, your application code remains agnostic of where the data is actually going. In our Observability Blueprint, we discussed the "Three Pillars" of observability. OpenTelemetry provides a unified API to handle all three. If you decide to switch your tracing backend from Jaeger to AWS X-Ray, you don't change a single line of application code; you simply update your configuration. This flexibility is a core part of our Production API Checklist for building resilient systems.
2) The OpenTelemetry Collector: The Swiss Army Knife
One of the most powerful components of the ecosystem is the OpenTelemetry Collector. Think of it as a transparent proxy for your telemetry. Instead of your application sending data directly to a cloud provider, it sends it to a local Collector. You can find the full technical specifications for the collector at OpenTelemetry.io.
Receive: It can accept data in multiple formats (OTLP, Jaeger, Prometheus).
Process: It can scrub sensitive data (like PII in logs), batch requests to save bandwidth, and add metadata like "environment: production".
Export: It can send the same data to multiple destinations simultaneously—for example, metrics to Prometheus and traces to Honeycomb.
3) Distributed Tracing and Context Propagation
In a distributed system, the biggest challenge is understanding how a single user request flows across multiple services. This is where Context Propagation becomes the "secret sauce." OpenTelemetry standardizes how "Trace IDs" are passed in HTTP headers (using the W3C Trace Context standard). This ensures that when Service A calls Service B, the trace continues seamlessly. Without this standardization, you end up with "broken" traces that make debugging intermittent latency issues almost impossible.
4) Auto-Instrumentation vs. Manual SDKs
One of the reasons OTel has gained such massive adoption is Auto-Instrumentation. For languages like Java, .NET, and Python, you can often attach an agent to your process that automatically captures traces for common libraries (like HTTP clients, database drivers, and web frameworks). However, as a senior engineer, you should also utilize the manual SDK to add "Custom Spans" for your business logic. This allows you to track specific domain-level events that an automated tool might miss.
5) Bridging the Gap to Platform Engineering
OpenTelemetry is more than just a library; it is a shift toward "Observability as Code." It forces you to think about how your services describe themselves to the outside world. This mindset is critical when you are moving toward advanced topics like service-to-service communication, which we explore in depth in our post on gRPC in Production.
If you want to master the art of building systems that are not only scalable but also "debuggable" in production, you need to understand the platform layer. Our **Production API's and Platform Skills** course covers the implementation of OpenTelemetry, along with gRPC, GraphQL, and advanced Authentication, to give you the toolkit of a true Lead Engineer.


